
Dashboard
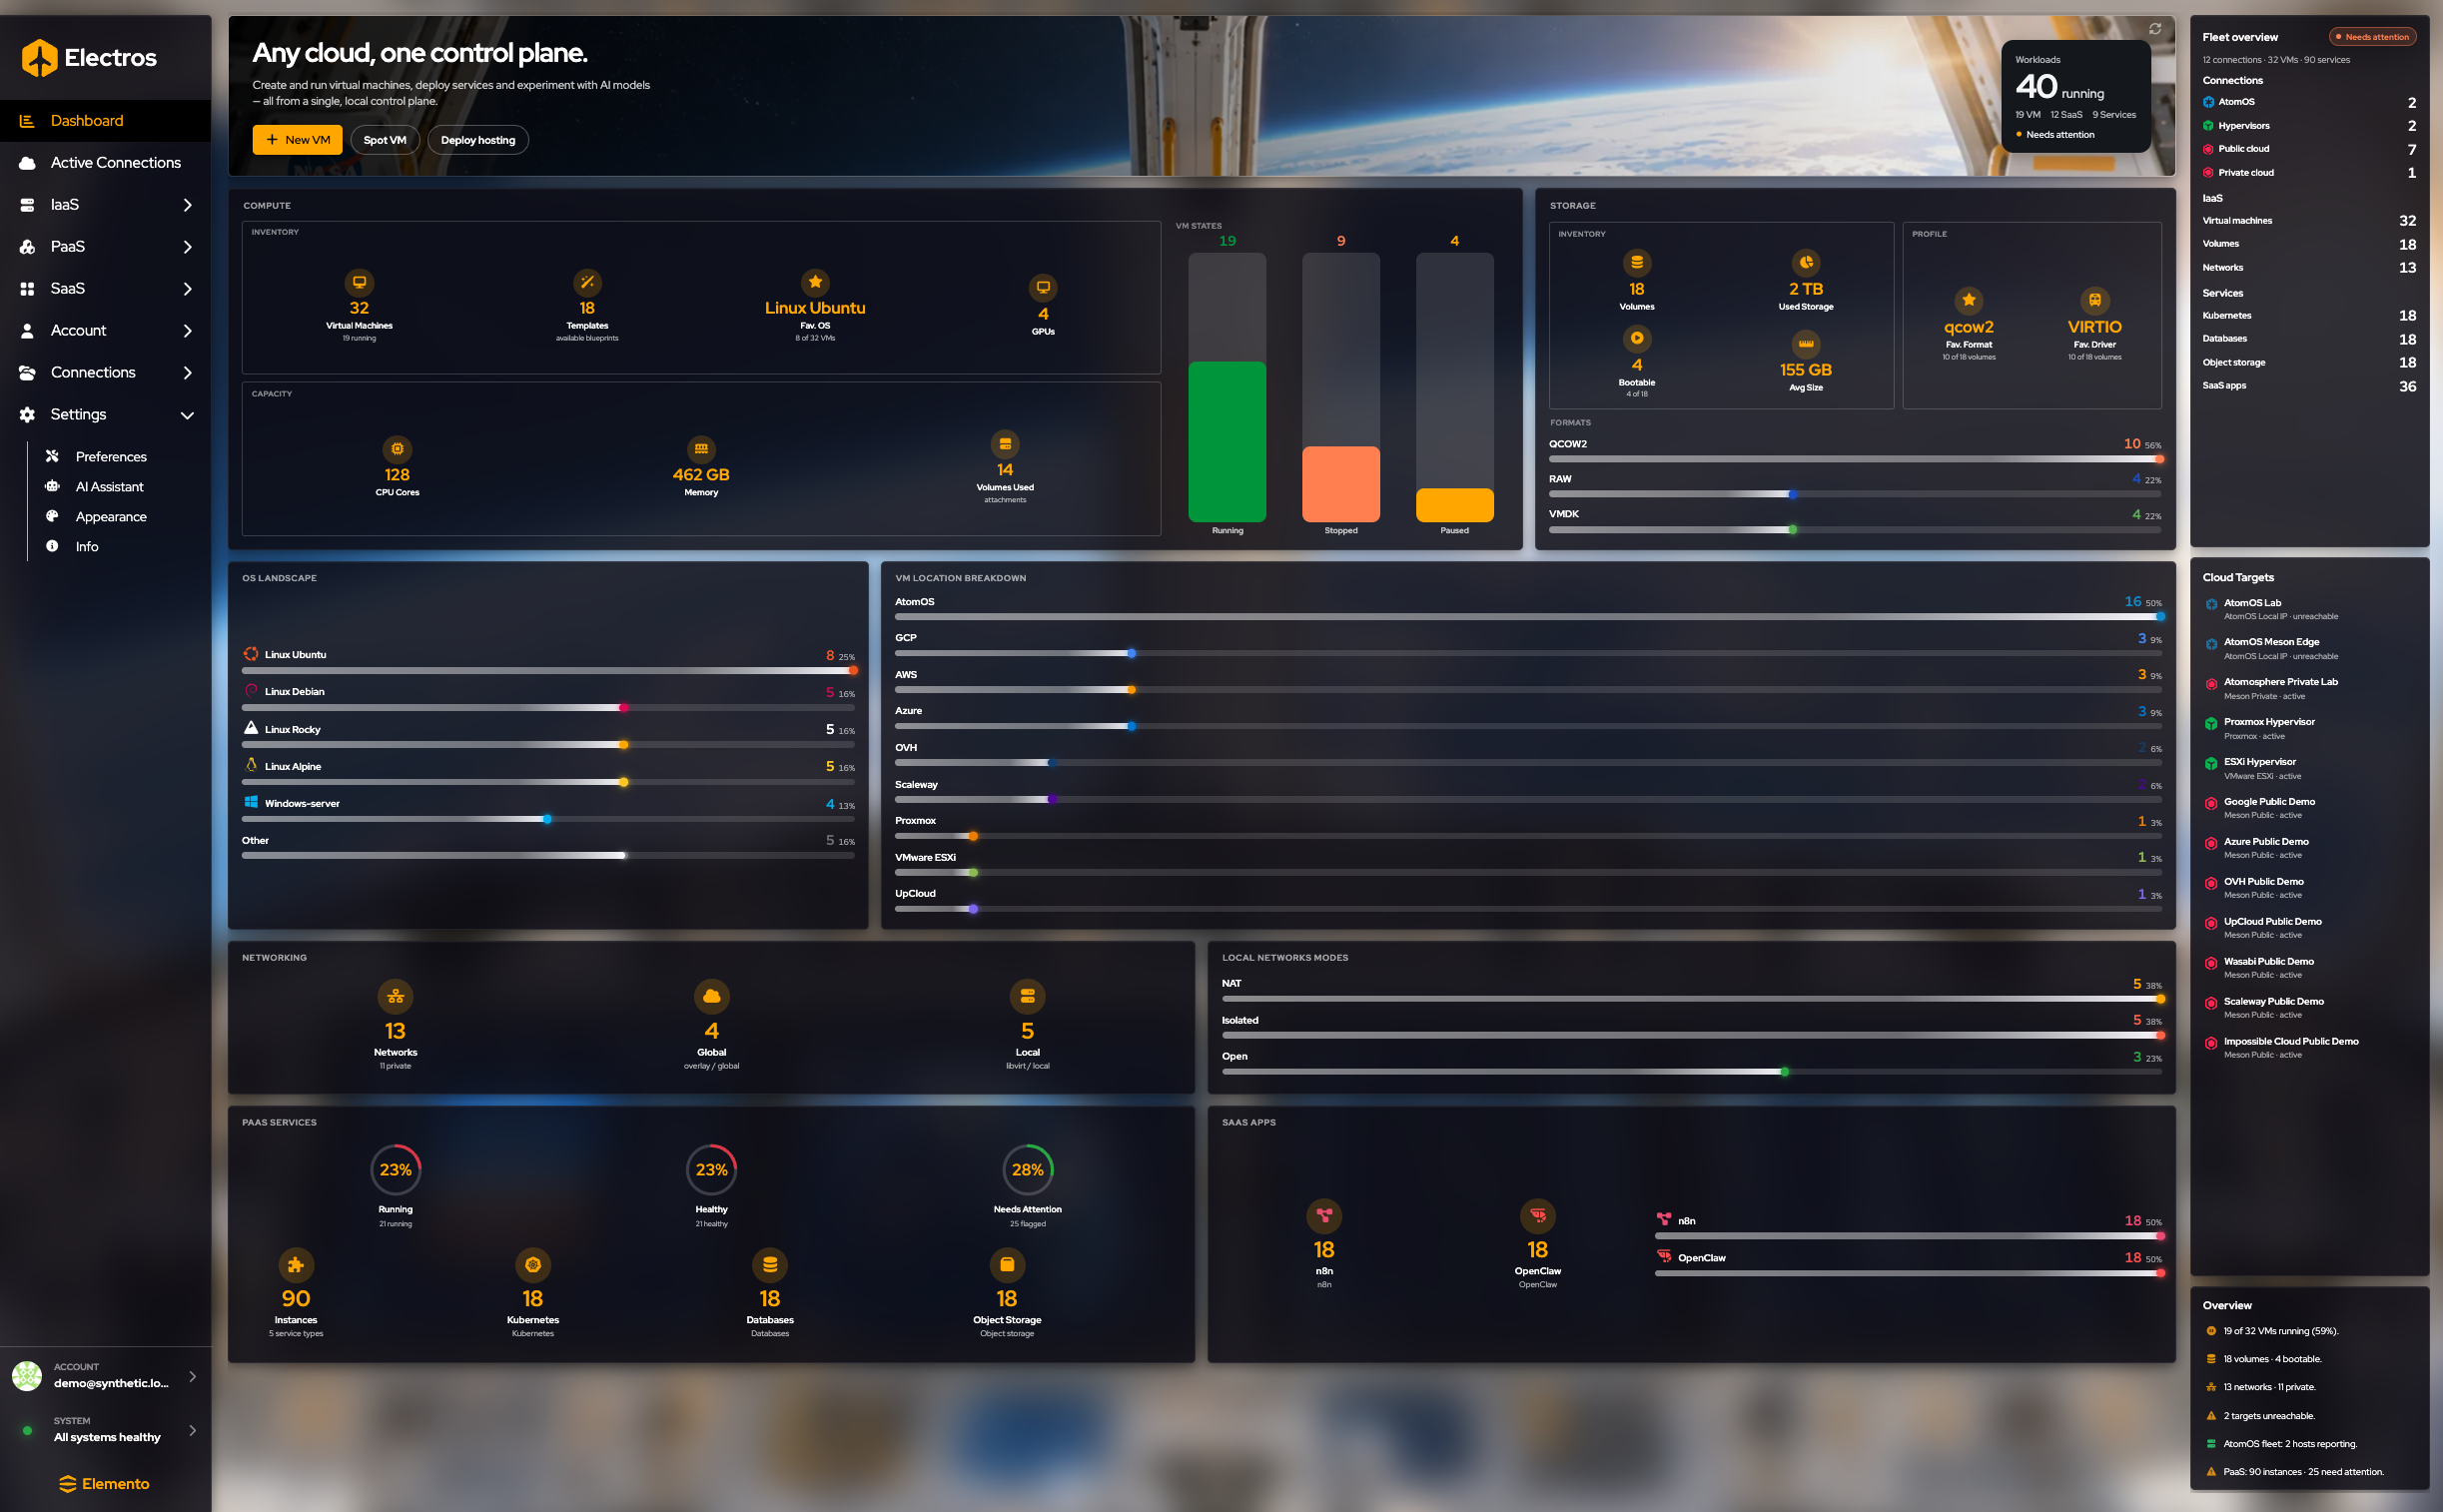
The dashboard is home. The banner reads Any cloud, one control plane. It does not create resources by itself. It tells you whether the fleet is healthy and gives you shortcuts into the create wizards.
What this page is for
The dashboard answers three questions before you open a wizard: is the fleet up, where are the machines, and which shortcut do I need. It does not edit a VM, a disk, or a bill. Those live on their own pages. Use it as the morning check, then jump.
Shortcuts in the header

| Button | Opens |
|---|---|
| + New VM | Create a basic virtual machine |
| Spot VM | Create a spot VM |
| Deploy hosting | A hosting / service create flow |
The small card at the top right counts running workloads (VMs, SaaS, services) and flags Needs attention when something is unhealthy. It is a summary, not a list you can edit.
How to read the panels
Read left to right, then the column on the right.
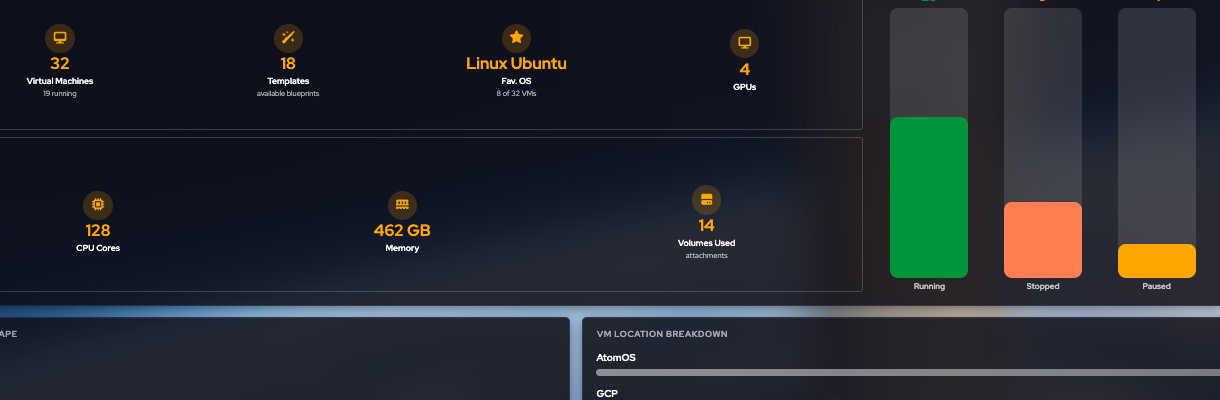
Compute. Inventory is how many virtual machines, templates, and GPUs you have, plus the most common OS. Capacity is cores, memory, and volumes in use. VM states splits the fleet into three bars: green Running, orange Stopped, yellow Paused.
Storage. How many volumes, how much space they use, how many are bootable, and which disk format and driver dominate (often qcow2 and virtio). The bars under the storage card are a format mix (QCOW2, RAW, VMDK), not a usage alarm.
OS landscape. Share of guests by operating system. Useful when you are about to standardise images.
VM location breakdown. Where those VMs actually run: AtomOS, a hypervisor, or a public cloud. If a provider you expected is missing, the target is probably disabled under Active Connections.
Networking. Network count, and how many are global versus local. Local network modes shows NAT, isolated, and open.
PaaS services and SaaS apps. Rings for running, healthy, and needs-attention, then counts per product (Kubernetes, databases, object storage, n8n, OpenClaw). Open the matching sidebar page to act on one instance.
The right-hand column
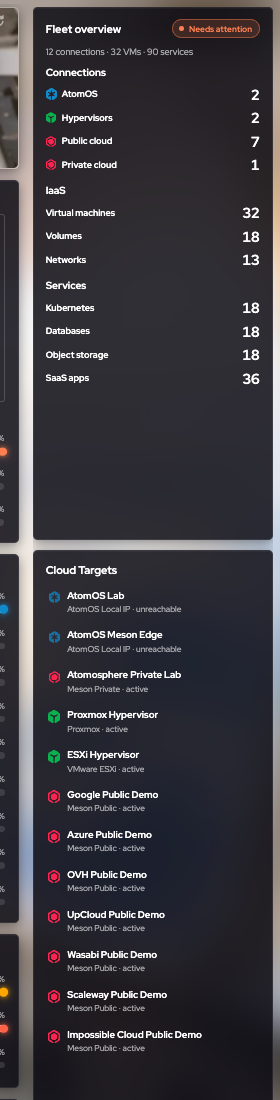
Fleet overview rolls the same fleet into one column: Connections, IaaS, PaaS, and SaaS, each with a count.
Cloud targets is the reachability list. A green dot means Electros can talk to that host. A red dot means unreachable — creates that need that host will fail or omit it. Fix the network, the daemon, or the target registration before you retry a wizard.
The lines at the bottom repeat the headline numbers in sentences (for example how many VMs are running, how many targets are down).
When the dashboard looks empty
An empty fleet still draws the panels, with zeros. That is not a bug. Add a target under Connections, enable it under Active Connections, then create a VM or volume. Reload the dashboard after that if the numbers do not move.